Use the Insights Grid when you need to answer "how many experts said X?", not "what did this one expert say?". It's the difference between reading forty calls and reading one table: a row per call or expert, a column per question.
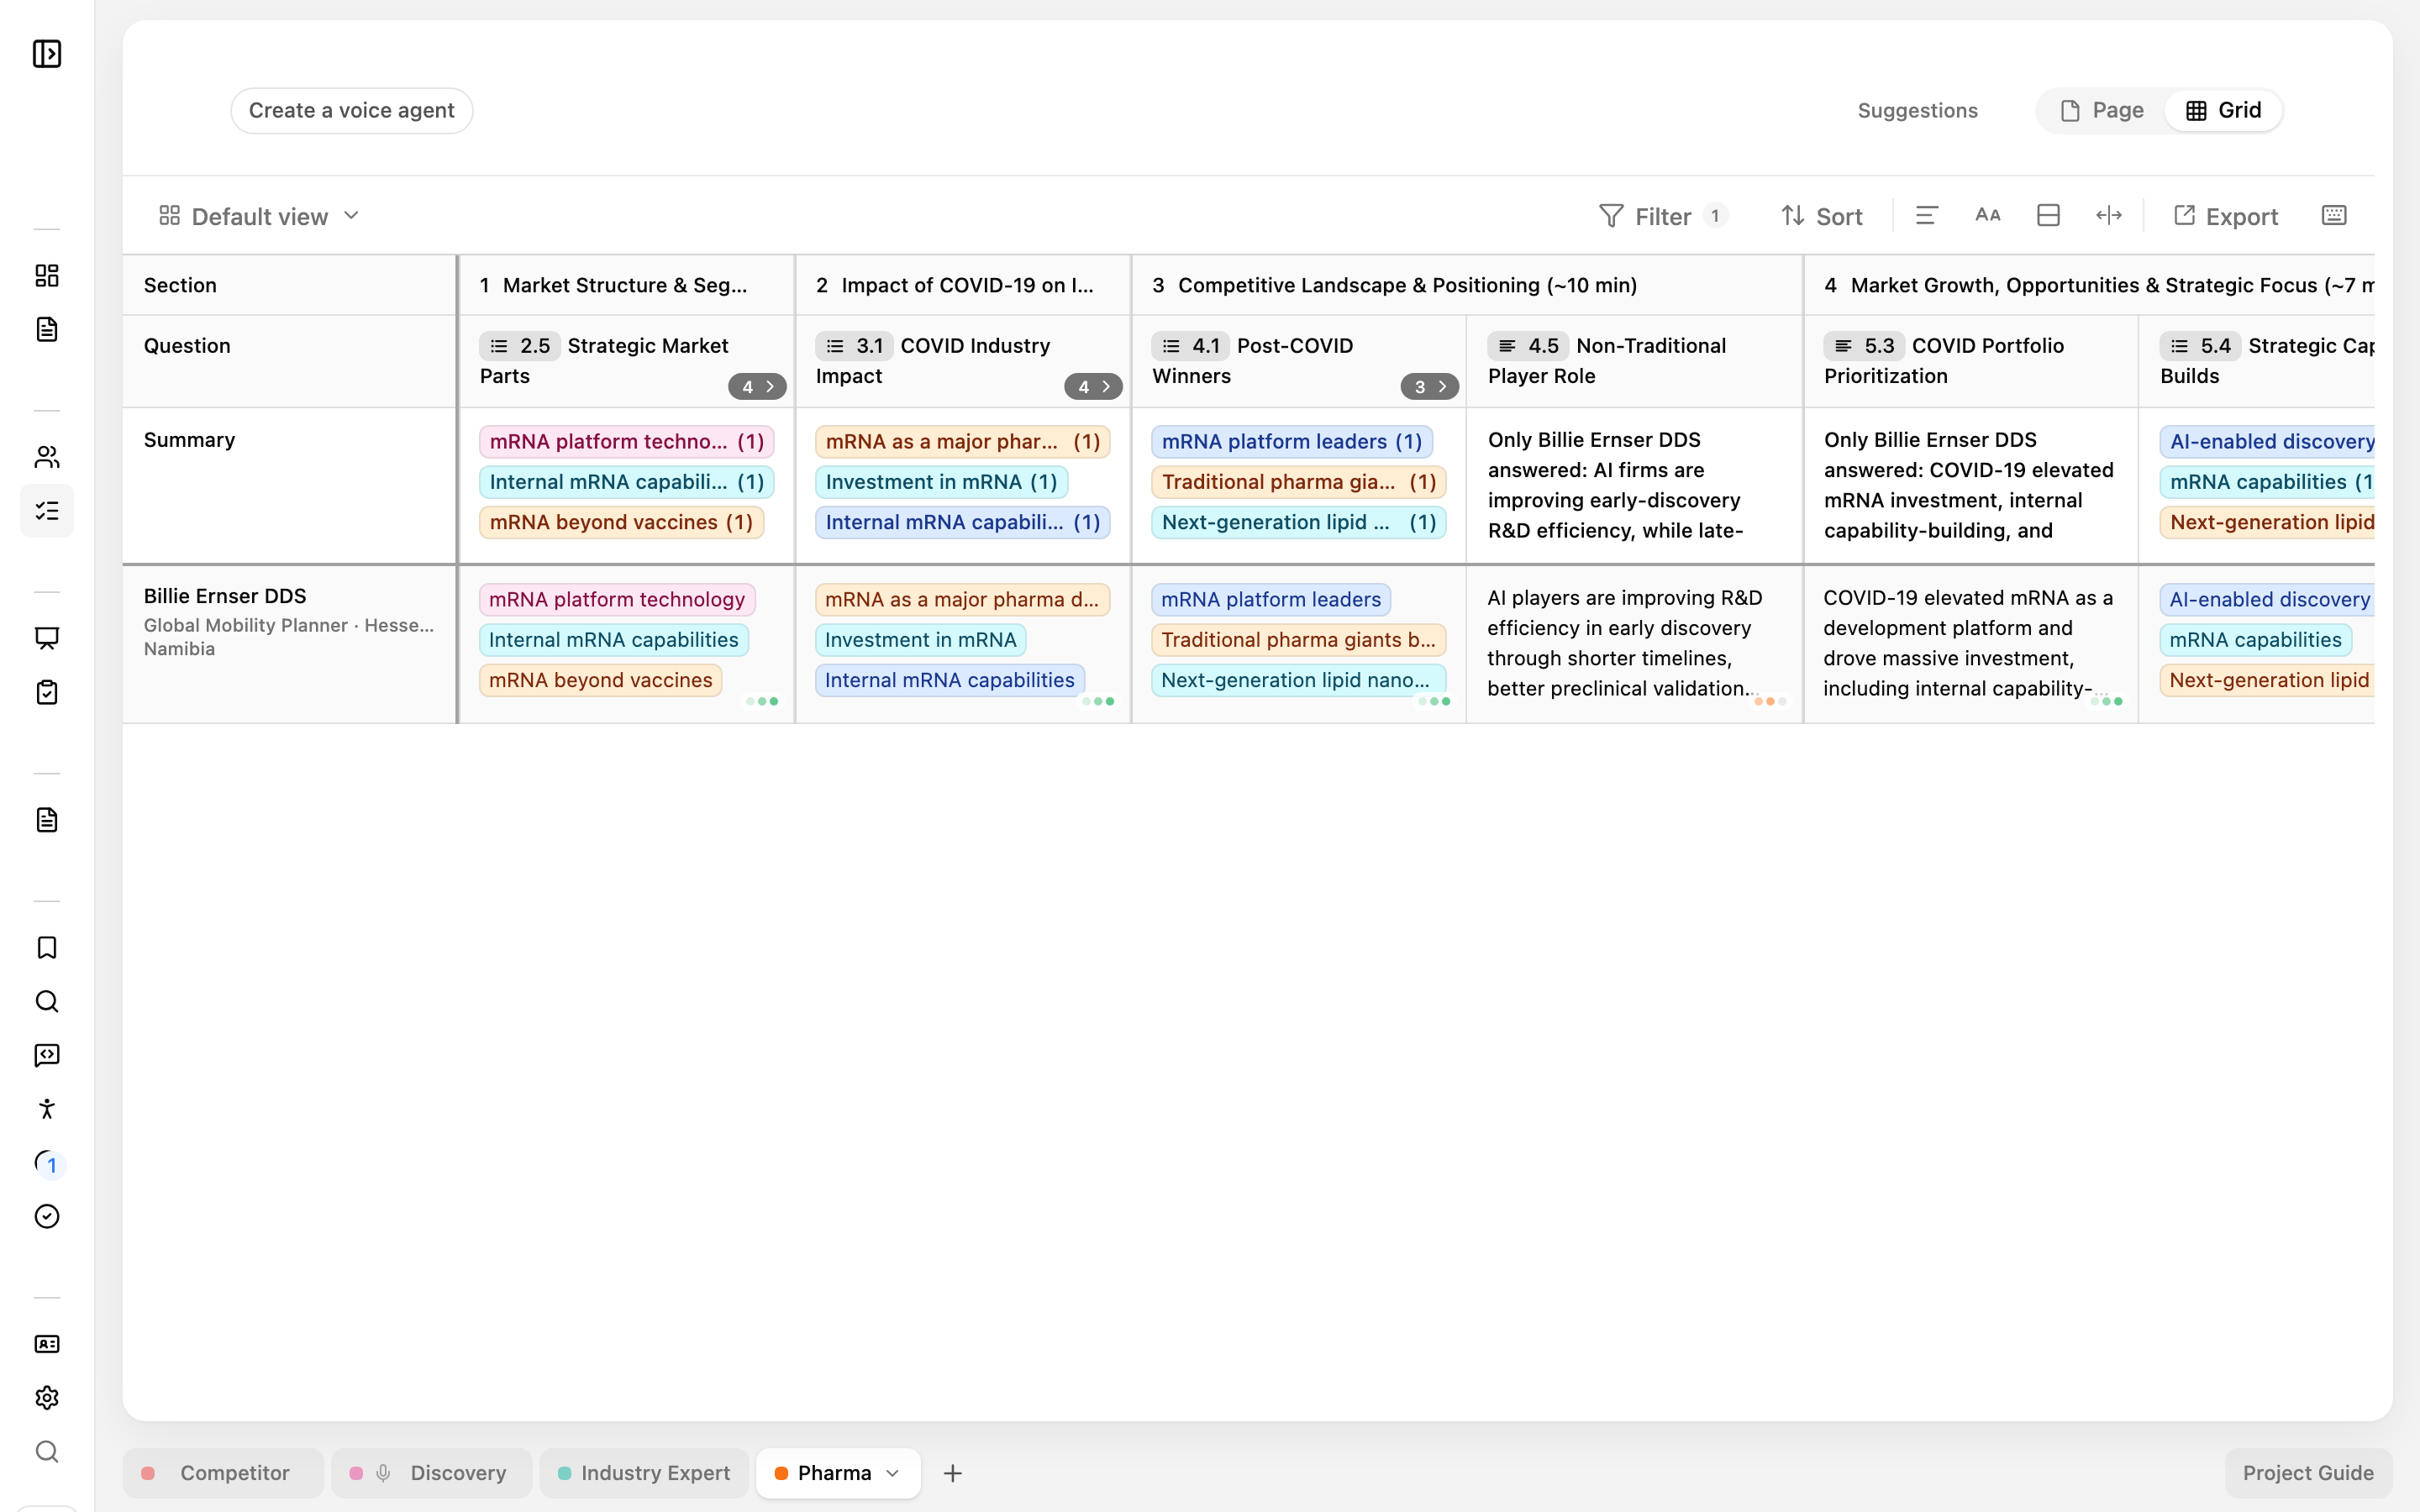
Setting up a grid
- Head to the Interview Guides section and define what questions you'd like Junior to track across your project. You can upload a pre-defined questionnaire, make Junior generate one for you, or write out the questions from scratch
- Define what segment the grid should apply to - in other words - what experts or call-segments should be tracked in the grid.
- Head to the upper right corner of the guide and toggle to grid-view.
How cells get filled
As calls come in, Junior automatically updates your grid. Click a question header for an instant summary across all your calls, or click into an answer cell to dig deeper and trace the data back to its sources.
For any cell, you can:
- Include or exclude specific source quotes to refine the answer.
- Edit the sources behind a value.
- Re-run or rewrite a cell to regenerate its answer.
- Export the grid to Excel for further analysis or sharing.